How can I make my tables and charts accessible?
At UADA, we use plenty of charts in our work. Making these charts accessible improves the reach of our programming and keeps us compliant with accessibility laws and guidelines. Ensuring that your charts meet accessibility standards isn't as hard as you might think!
Don't forget about using alt text
If your graph or chart has been included in your document or website as an image, you will need to make sure that you have included alt text for the image. In your alt text, try to summarize what is going on in your graph, what are the conclusions someone can draw from this figure, and why it was important enough to include in your work.
Do your best to keep your description to less than 120 characters. Some screen readers are incompatible with longer alt text descriptions.
Read more about alternative text here
Repeat the data in your graph or chart in a table
To increase the accessibility of your charts, include the tabular data in addition to your chart or graph. This allows users who are accessing your information with a screen reader to still have a way to navigate through your information without missing out on anything.
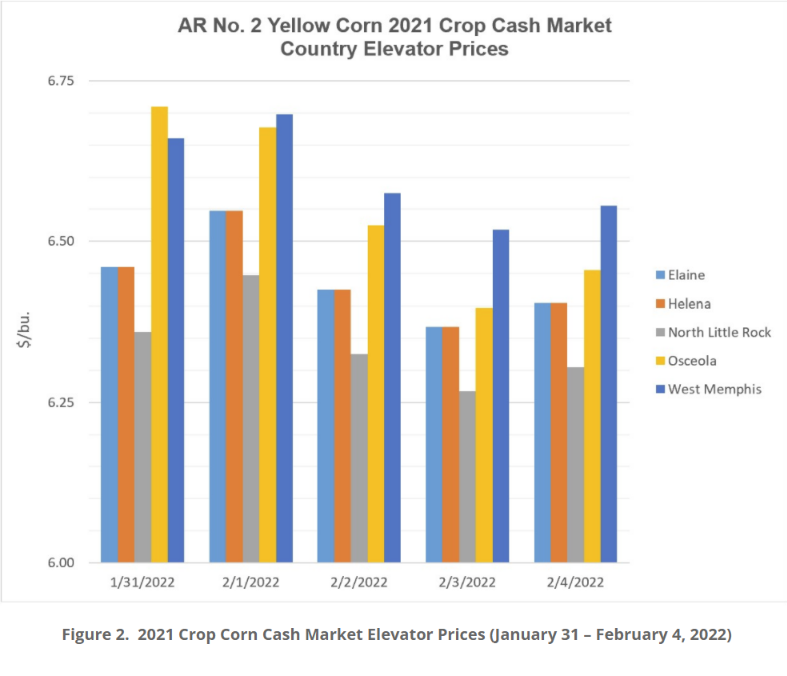
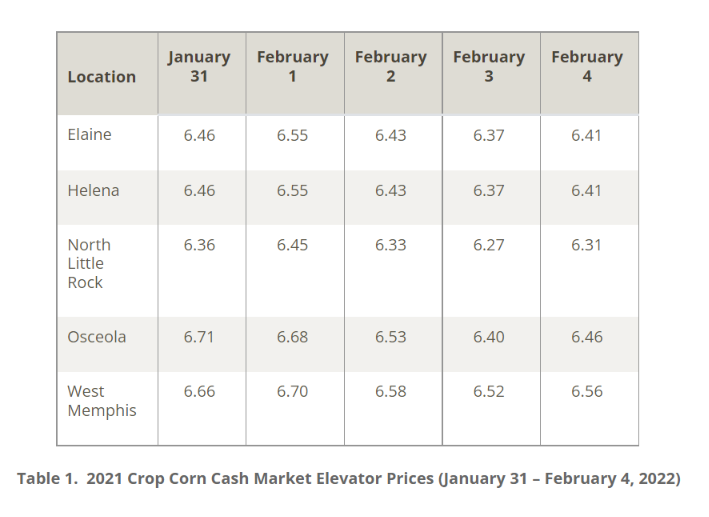
In this example taken from the Arkansas Corn 2021 Crop Cash and 2022 New Crop Booking Market Report, the same data is presented as both a bar graph and as an accessible table.
Add long text descriptions for charts
Since charts and graphs display complicated information as a visual, it can be hard to conceptualize what is going on in a graph if you are only presented with a list of numbers in a table. By adding a text description to your audience, you can help both your visually impaired and sighted users better understand and interpret your information.
A text description is typically longer than an alternative text description, and is found near the graph itself.
Explain to your audience why your graph is important enough to include in your work. What important trends are you showing? How are these trends important in context? What 'main idea' should you audience be understanding from this graph?
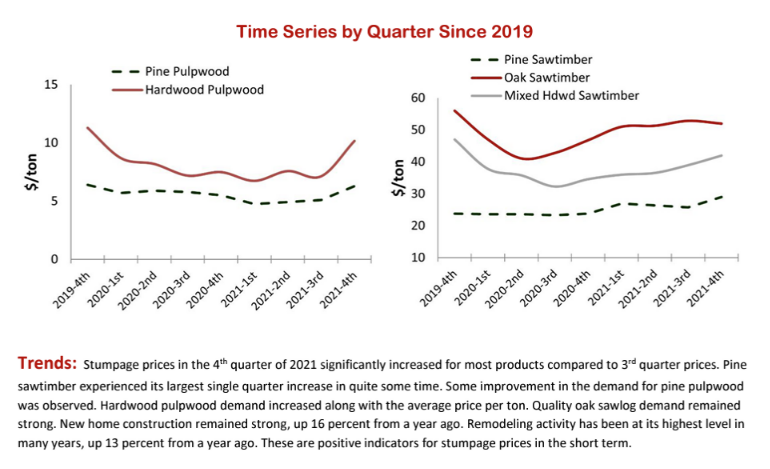
In this example taken from the 4th Quarter 2021 Arkansas Timber Price Report, a "Trends" description is added under the line graph. This description is used to further explain the purpose and findings of the accompanying graph and increases the accessibility of the report.
Pay attention to colors and patterns!
When you present your data as a graph or chart, be mindful of the colors you choose to present the information. Most sited users - even people with 20/20 vision! - need enough color contrast between the main content you are presenting and its background so that it can be read easily. Having high contrast in a design is even more important for users who have low vision or who are colorblind.
If appropriate, adding a pattern to your charts and graphs will also increase its accessibility. This helps distinguish the data information from the surrounding information.
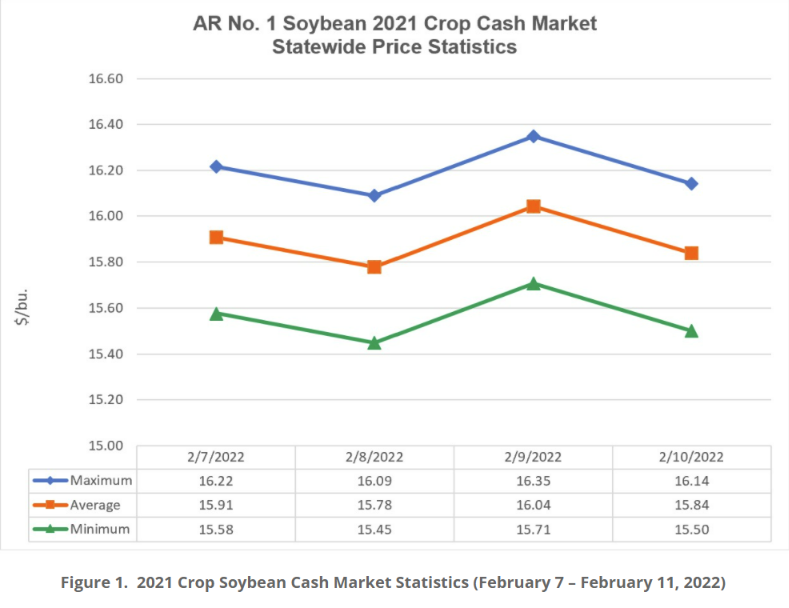
In this example, taken from the Arkansas Soybean 2021 Crop Cash blog post, the author uses both accessible color contrast and a variation of shapes to represent different data sets. By combining both color and patterns that increase accessibility, more users can understand this graph and it's meaning in context.
Read more about color and color contrast here
Additional Resources
Table Concepts - Web Accessibility Tutorials
Creating Accessible Tables - WebAIM
Table Accessibility - Princeton University
Still need help?
Let us know! We are happy to help make your tables and charts more accessible.
Please contact accessibility@uada.edu